Back-of-the-Envelope Estimation
Back-of-the-Envelope Estimation
"We'll just keep everything in memory" sounds reasonable until two minutes of arithmetic show the data is 40 TB. Rough math, often called back-of-the-envelope estimation, is how engineers catch ideas like that before building on them. You do not need exact numbers. You need to know whether you are facing a gigabyte problem or a petabyte problem, a hundred requests a second or a hundred thousand, because that is what decides the design.
The obvious approach: skip the numbers
It is tempting to jump straight to boxes and arrows: a load balancer, some servers, a database, a cache. The trouble is that without numbers, every design looks equally good. Three servers or three hundred? One database or a sharded cluster? A cache, or no cache? These questions only have answers once you know the size of the problem, and the size can change the right answer completely.
The handful of numbers to remember
You only need a few, and you round all of them.
- Time. A day has 86,400 seconds; call it 100,000. So 1 million of anything per day is about 10 to 12 per second.
- Sizes. Each step up is about 1,000 times bigger: KB, MB, GB, TB, PB. One plain-text character is about 1 byte.
- Network units. Network speeds are in bits, storage in bytes, and a byte is 8 bits. A 1 Gbps link moves about 125 MB per second, not 1 GB.
- Speed. Memory is fast, disks are slower, and the network is slowest. The gaps are enormous:
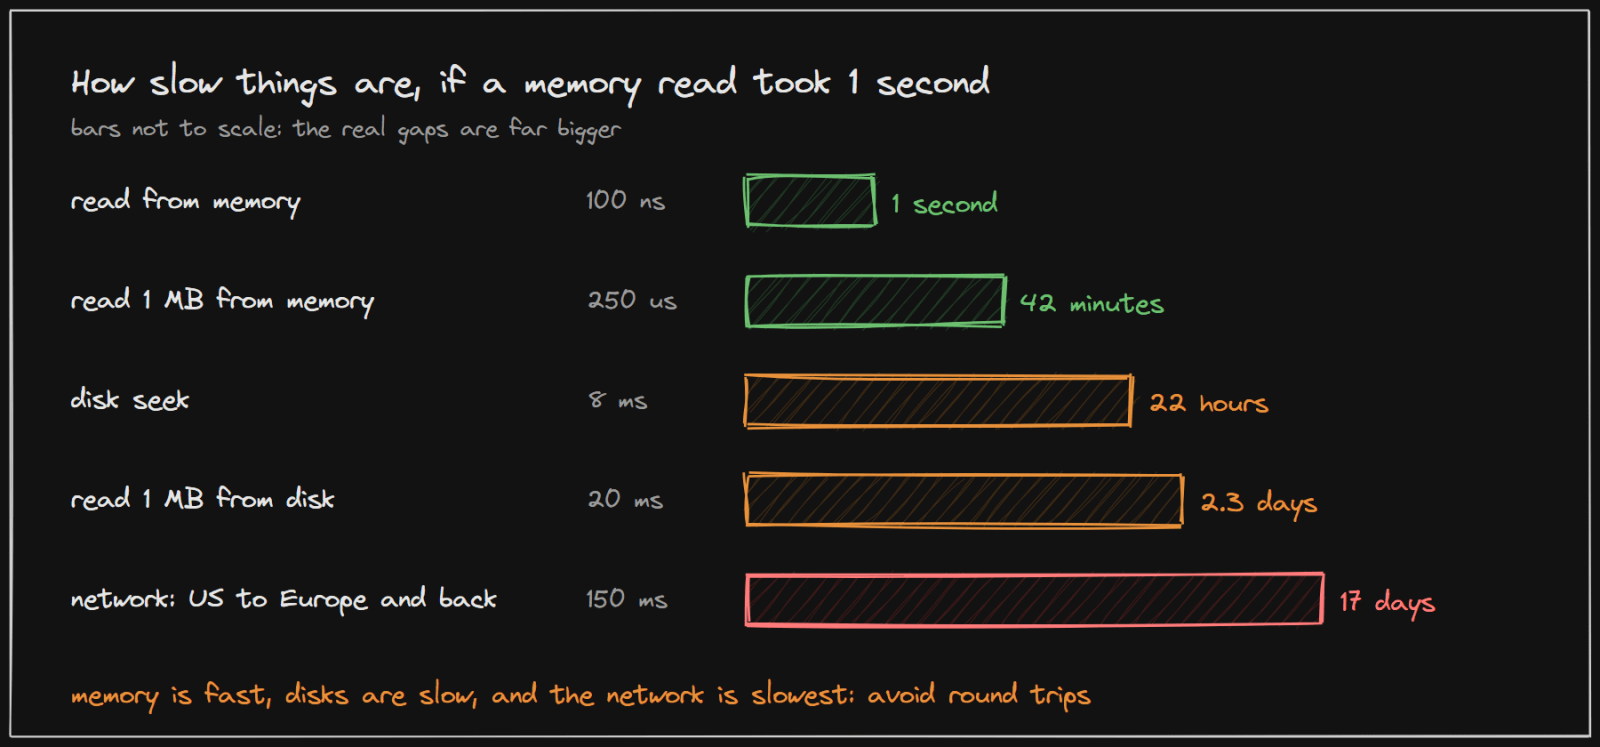
These come from Peter Norvig's well-known table of approximate timings. Hardware has improved since he wrote it (solid-state disks are much faster than the spinning disk in his table), but the shape has not changed: every trip to disk or across the network costs a huge amount compared with memory. That is why good designs avoid unnecessary round trips.
The recipe, step by step
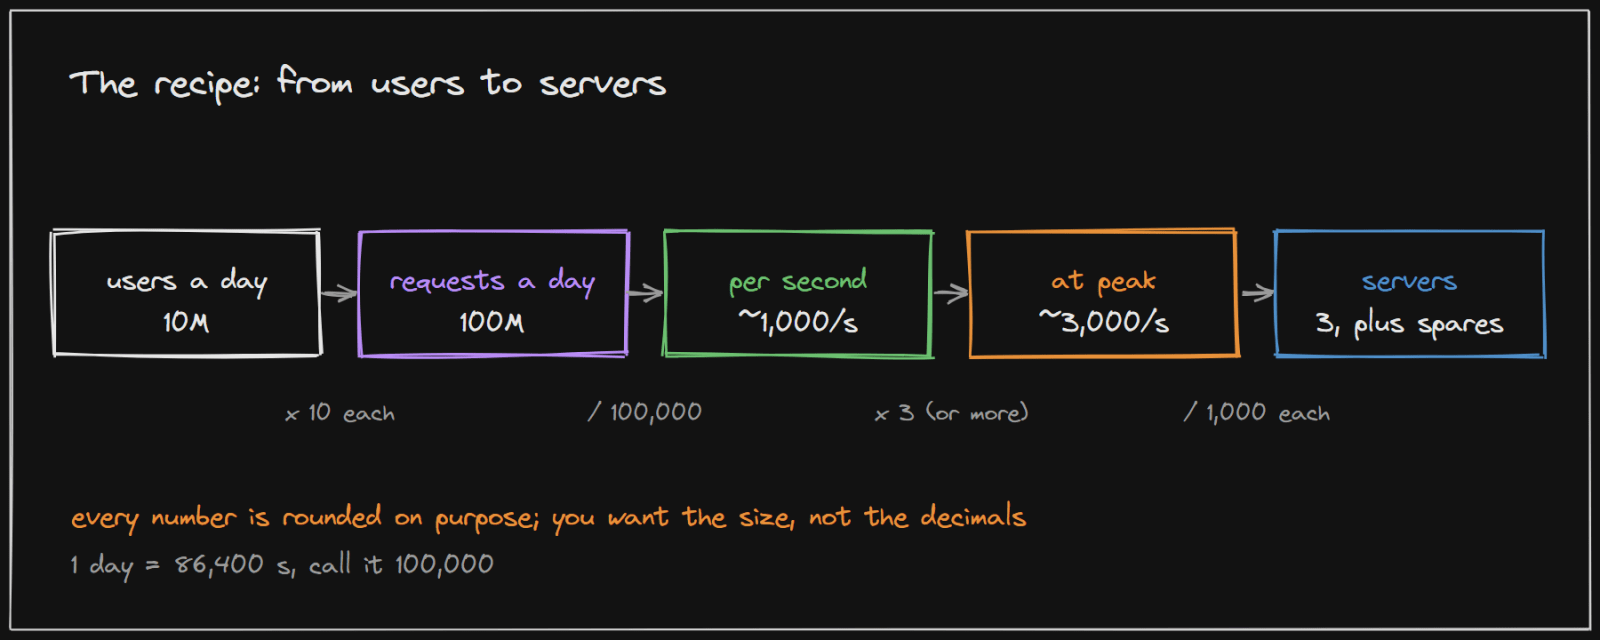
Say aloud what you are assuming, then follow the chain.
Step 1: requests per second
Start from users. Suppose 10 million daily users each make 10 requests a day. That is 100 million requests a day. Divide by 100,000 seconds: about 1,000 requests per second on average.
Step 2: the peak
Traffic is never spread evenly. Mornings, evenings, a big match or a viral post all bunch it up. A common rough assumption is two to three times the average, so about 3,000 requests per second. But as the real example below shows, a single event can push it far higher. Always ask what your busiest moment looks like.
Step 3: servers
If one server handles about 1,000 requests a second (an assumption you would state), the peak needs 3 servers, plus spares so that one can fail or be upgraded without trouble. The answer is "a handful", not "one" and not "hundreds". That alone shapes the design.
Step 4: storage
Suppose users create 10 million posts a day at about 200 bytes each:
- per day: 10,000,000 x 200 bytes = 2 GB
- over 5 years: 2 GB x 365 x 5 = about 3.65 TB
A few terabytes fits on one well-equipped database server, so sharding can wait. If the same sums had come out at 3.65 PB, splitting the data across many machines would be a day-one requirement. Remember to multiply by the number of copies you keep (often 3) and to allow for growth.
Step 5: bandwidth
Multiply requests per second by the size of each response. At 3,000 requests a second and 100 KB per response, that is 300 MB per second, or about 2.4 Gbps. Numbers like that are why large files go through a CDN instead of your own servers.
A real system: Twitter's record peak
In 2013 Twitter's engineering blog described the moment its own traffic broke a record. On a normal day, it said, "we normally take in more than 500 million Tweets a day which means about 5,700 Tweets a second, on average". Then, during a television broadcast in Japan, viewers all tweeted at the same moment and Twitter hit "a one-second peak of 143,199 Tweets per second".
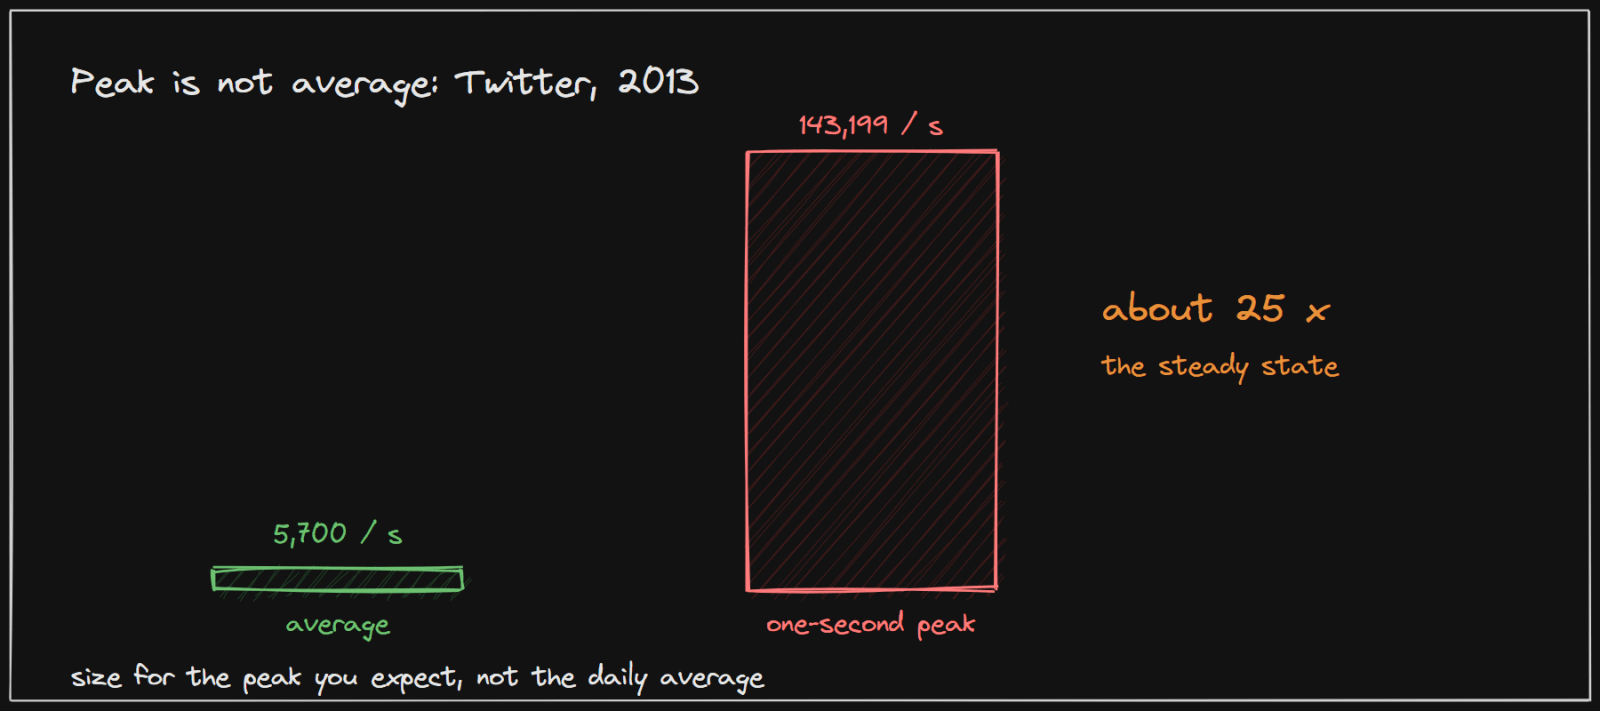
Twitter put it plainly: the spike "was around 25 times greater than our steady state", and users "didn't experience a blip". Two lessons:
- The rough math checks out. 500 million a day divided by 86,400 seconds is about 5,800 a second, which matches their stated average. The recipe above works on real systems.
- Peaks can dwarf averages. "Two to three times the average" is a starting assumption, not a law. A system built only for its average would have fallen over that night.
Common mistakes
- Sizing for the average. Systems fail at the peak.
- Mixing bits and bytes. A factor of 8 hides in every network figure.
- Forgetting copies and growth. Replicas, backups and next year's users all need room.
- Fake precision. "11,574 requests per second" suggests accuracy you do not have. Say "about 10,000".
- Never checking the answer. If the result says a chat app needs a petabyte on day one, recheck the assumptions before redesigning.
How to use this in an interview
- State your assumptions out loud: users, requests per user, object sizes, how much the peak exceeds the average.
- Round hard so the arithmetic stays in your head.
- Say what each number means for the design: "about 3 TB, so one database is fine for now"; "about 300 MB a second of images, so we need a CDN".
Every algorithm page in the visualizations has a sizing panel that runs this kind of arithmetic live, so you can see how changing one assumption moves the result.
Implementing it in your project
- Keep the estimate in a small spreadsheet or script with the assumptions as inputs: users, requests per user, object sizes, peak factor. Revisit it when real numbers arrive.
- Measure one server instead of assuming. A load-testing tool such as k6 or JMeter, pointed at a staging copy, tells you how many requests a second one instance really handles before latency rises. Never load-test production.
- Watch the real numbers after launch: requests per second at the busiest hour, database size growth per week, and bandwidth. Compare them with the estimate to see which assumption was wrong.
Sources and credibility
Everything above is written from scratch; the only figures and quotes come from the sources below, attributed where used.
Primary (highest confidence)
- New Tweets per second record, and how!, Twitter Engineering blog, 2013. Source of the 500 million tweets a day, the 5,700 average, the 143,199 one-second peak and the "25 times" comparison.
- Teach Yourself Programming in Ten Years, Peter Norvig, the section "Approximate timing for various operations on a typical PC". Source of the latency figures in the speed diagram. The figures describe hardware of that time; treat them as orders of magnitude.
Method
- The step-by-step estimation approach follows the back-of-the-envelope chapter of Alex Xu's System Design Interview, Vol. 1. The worked examples are our own.
On copyright: the diagrams on this page were drawn for this article, and the explanations are original. Quoted phrases are short and attributed.